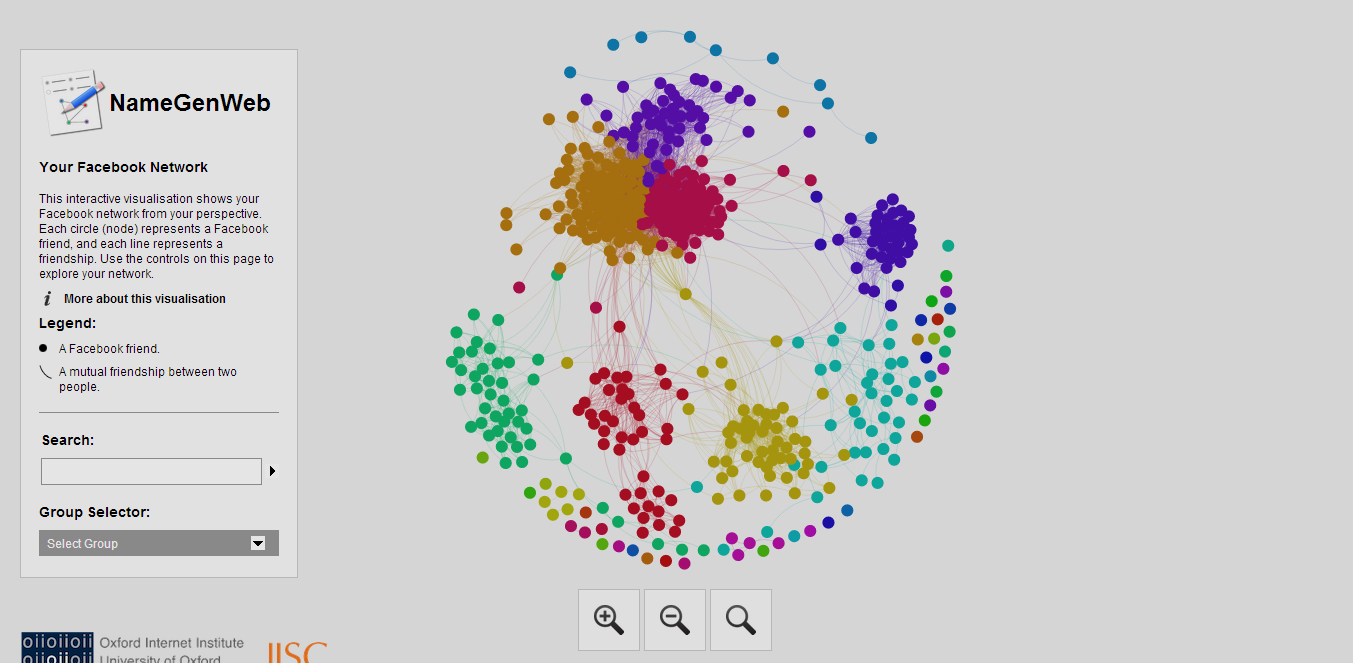
Graphical Representation of your facebook connections
Visualizing you facebook connections through graph:
 |
| Each dot is your friend. Each closest dot is a group each color denotes some unique attributes shared amoung each other [same university or same college etc.] |
Just spend 2 minutes and you can get home with your own graph. And the steps are..
- Login to your facebook account.
- Paste this url in another tab: https://apps.facebook.com/namegenweb/
- Click get started button.
- Check the box "I hereby give consent.." and then press continue button.
- You can play around with the required attributes you want to see. For now we just click download button with the defaults.
- Now click again the download button under the heading "Step3: Downloading ties"
- Progress indicator will appear and moves into "step4: Explore your network"
- Leave the Download format with default "GraphML" file type and press download button. Your file will be downloaded. You can view it offline using "GraphML viewer". OR More easy option is you can just click the "Launch Visualiser" button and wait for sometime until it shows the graph.
 |
| Click on Launch visualizer for automatic viewing of your GraphML file with out having to download the file. |
- Each dot is a friend of yours (hover over it you'll find their name or click the dots for their detailed infos). Each were colored based on their common group you and your friends were sharing. Go on just play around with it.
- Atlast now you have a overview of your groups and connections that you have created from your entire facebook history. You can mine yourself some unknown titbit data's about yourself from it {ex. which group has more friends, Click on any person and zoom it to know where they are connected (follow the thin line) to your other mutual friends etc. }.
Hope you explored it!!

Comments
Post a Comment